

Kodaikanal Solar Observatory Scientists Uncover New Clues to the Sun’s 11-Year Cycle: NEW DELHI — For over a century, the Kodaikanal Solar Observatory has quietly trained its lenses on the skies, capturing the violent, churning reality of our closest star. Today, that unmatched archival patience has paid off.
Using more than 100 years of solar data, scientists at the Indian Institute of Astrophysics (IIA) have uncovered new clues about the Sun’s surface behavior. The groundbreaking study offers a clearer window into how massive convection patterns respond to the Sun’s infamous 11-year activity cycle—a discovery that could significantly improve our ability to predict space weather.
The Cosmic Boiling Pot
To understand the discovery, one must imagine the Sun not as a solid orb, but as a colossal, boiling pot of water. The immense energy generated in the solar core forces its way outward, transported through the outer layers via a process called convection.
This churning motion creates distinct structures on the solar surface: small-scale granulations and massive, web-like networks known as supergranulations.
The Scale of a Supergranulation
Average Lifetime: 24 hours
Average Size: ~30,000 kilometers (More than twice the diameter of Earth)
Intergranular Lane Width (Cooler boundaries): ~6,000 kilometers
For decades, the exact origin of these supergranulations, what dictates their massive size, and how they tie into the Sun’s 11-year magnetic cycle have remained enduring puzzles in astrophysics.
READ: ISRO creates history with 100th successful satellite launch
Cracking the Archival Vault
To find answers, a research team led by Prof. K.P. Raju turned to the Kodaikanal Solar Observatory’s historic treasure trove. The team meticulously analyzed over 34,000 digitized Ca II K spectroheliograms dating all the way back to 1907. These specialized images capture the solar chromosphere, highlighting the magnetic “networks” that form when magnetic flux is squeezed into the boundaries of the boiling supergranular cells.
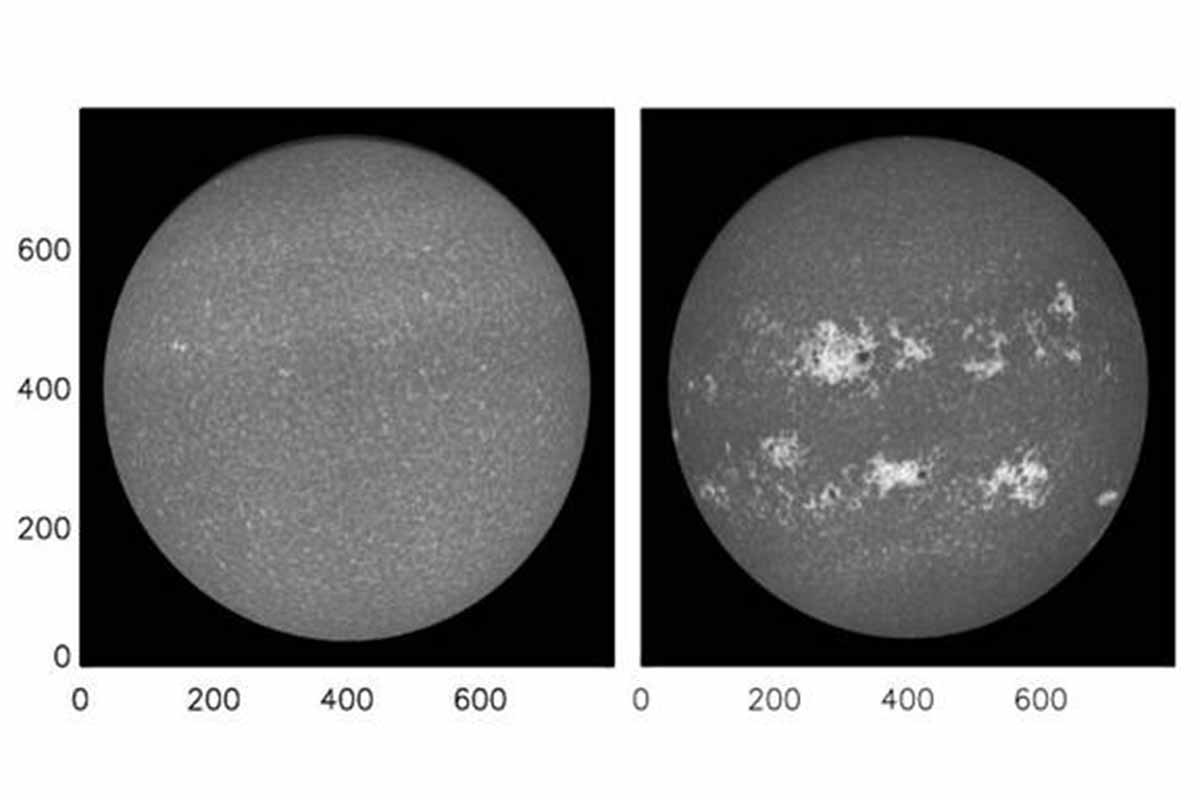
By comparing images from periods of extreme solar quiet (solar minimum, such as 1913) to periods of violent activity (solar maximum, such as 1917), the team examined two crucial physical quantities: the width of the intergranular lanes and their intensities.
[Solar Minimum (e.g., 1913)]  --> Lower magnetic activity, distinct network structures
           VS.
[Solar Maximum (e.g., 1917)]  --> High sunspot density, compressed/altered lane widths
The Latitude and Time-Lag Twist
The study, published in The Astrophysical Journal Letters, revealed that lane widths and intensities correlate strongly with sunspot numbers. However, the Sun does not react uniformly. The strongest correlations peak around specific latitudes:
Lane Widths: Peak at $(18 \pm 2)^\circ\text{N}$ and $(20 \pm 2)^\circ\text{S}$.
Intensities: Peak at $(13 \pm 2)^\circ\text{N}$ and $(14 \pm 2)^\circ\text{S}$.
This variance proves that no single latitude perfectly tracks the solar cycle for every physical trait. Furthermore, the researchers discovered a fascinating temporal lag in how these features respond to solar peaks.
While lane widths react and change almost in tandem with the solar maximum, intensity changes lag behind, peaking 1.25 to 1.5 years after the solar maximum has passed. This delay depends heavily on latitude—shrinking to zero near $\pm20^\circ$, decreasing toward the poles, and stretching out significantly as it approaches the equator.
READ: General NS Raja Subramani Assumes Office as India’s Third CDS
Why It Matters for Earth
“Our findings suggest that supergranular properties, such as lane width and intensity, are influenced by local magnetic flux and solar activity levels,” explained Prof. K.P. Raju. “The study highlights the importance of understanding these correlations for predicting solar activity and its effects on solar irradiance variations, particularly in the UV spectrum.”
Changes in solar irradiance affect everything from satellite lifespans in low-Earth orbit to power grids on the ground. By understanding how the surface “skin” of the Sun shifts and delays its reactions over a 11-year cycle, scientists can build more accurate models to forecast solar storms.
While this 100-year dataset has mapped nine distinct solar cycles and answered critical questions, the investigation is far from over. Scientists are already looking toward the future, noting that the upcoming National Large Solar Telescope (NLST), with its cutting-edge, high-resolution capabilities, will allow researchers to peer even closer into the violent, beautiful dynamics of the solar surface.
Don’t Miss: PM Modi Welcomes AirTrunk’s Massive $30 Billion Bet on India’s AI and Cloud Future
Don’t Miss: Clearing the Smog: Inside the Cabinet’s ₹9,585-Crore Gamble to Clean Delhi-NCR’s Skies